Home
Facilities
Research
Coral Reefs
Mesophotic Reefs
Reef Fish Spawning
Species Diversity
Oceanography & Weather
Water Temperatures
Meteorological Monitoring
Ocean Observations
Marine Lakes
Types Of Marine Lakes
Jellyfish Lake
Biodiversity
Marine Lakes Research
Fisheries
Reef Fisheries
Oceanic Fisheries
Imagery & Technology
Underwater Technology
Aerial Photography
Stereo Video
Terrestrial Environments
Education
Interns
Public Service
Posters
Data & Publications
Publication List
Technical Reports
Data Archives
Projects
Dugongs
Bathymetric Mapping
Climate Change in Palau
Our Team
History
Our Collaborators
About Palau
Contact
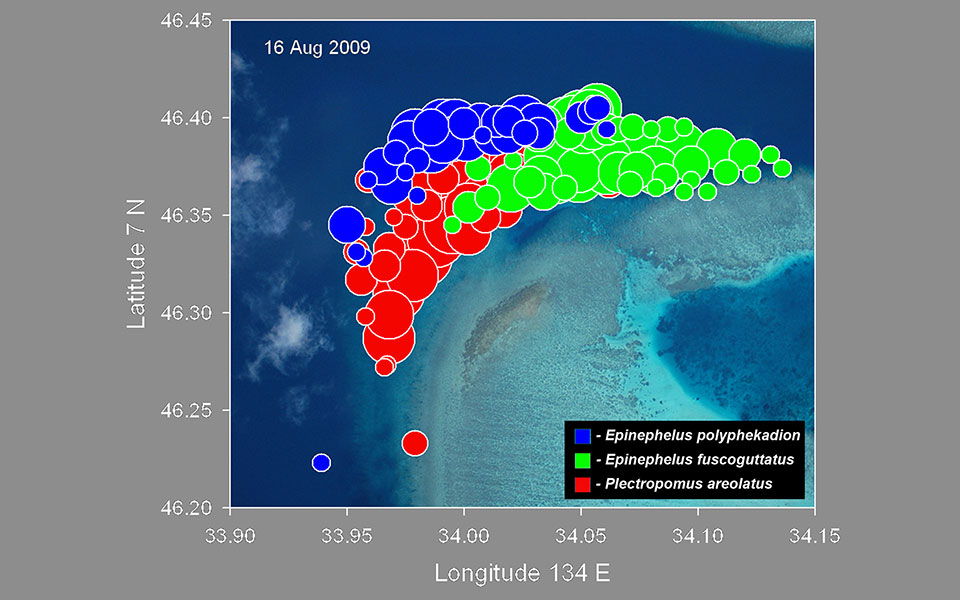
Fig.-2009-08-16-all-on-aerial
Home
>
Reef Fish Spawning
>
Fig.-2009-08-16-all-on-aerial
This function has been disabled for
Coral Reef Research Foundation
.
OK