Meteorological Monitoring
Along with the physical monitoring of aquatic parameters, keeping track of the weather (short term) and climate (long term) is an important aspect to understanding the processes affecting marine and terrestrial communities. While some type of meteorological information can be gleaned from remote sensing, for marine areas it is also important to have data collected by standard meteorological instruments close to the specific area of interest. The Republic of Palau has an excellent NOAA standard weather station, previously located in the middle of Koror town itself (since 1951), and presently (since 2018) located at the Palau airport on Babeldaob. The original NOAA weather station location was not ideal as the original site was inland and surrounded by trees, buildings and other structures. It was therefore not actually measuring the weather conditions directly on the reefs. To provide relevant real-time weather data for these applications, CRRF runs and manages several remote weather stations whose data is extremely important to understand the state of Palau’s reefs.
CRRF Weather Stations
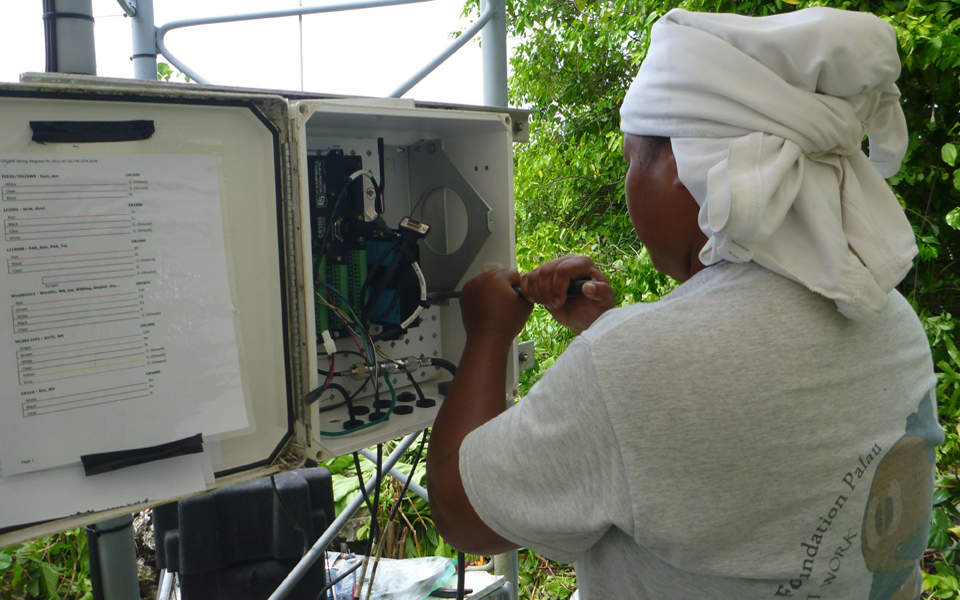
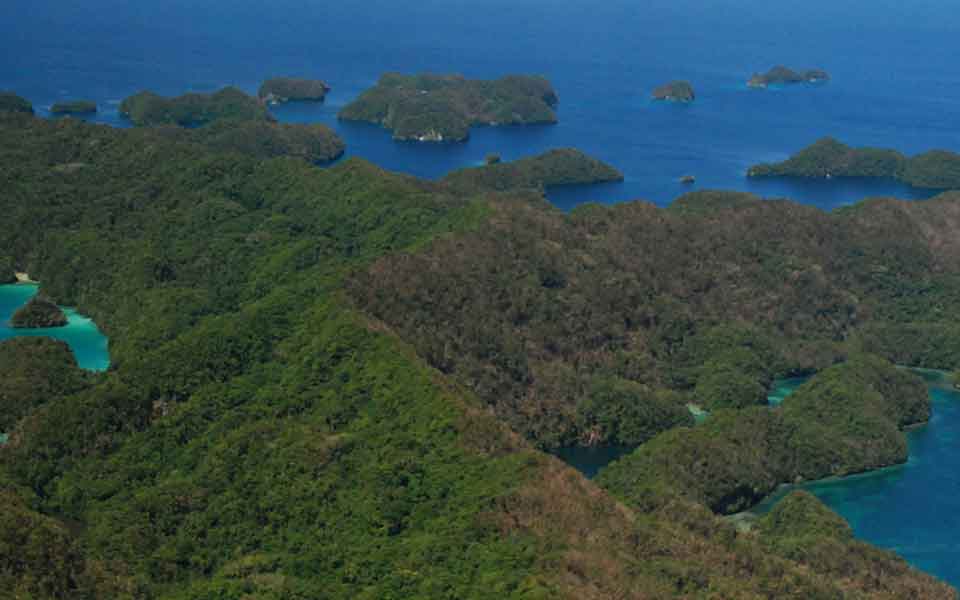
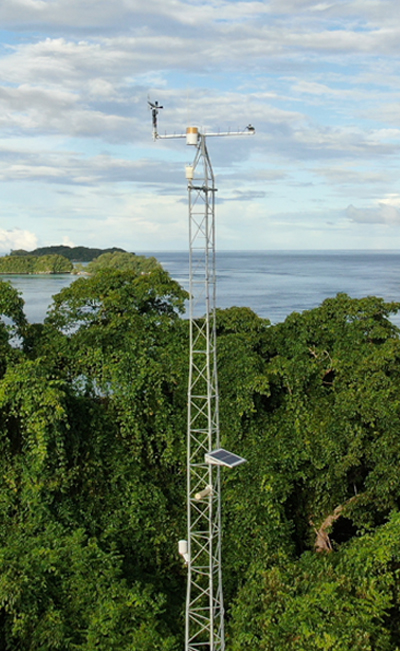
CRRF established an autonomous weather station on Ngeanges Island (7.20839° N, 134.37272°E) in the central rock islands in 2007. The station is on a 40ft (12m) tower on top of a 100ft (30m) rock island, as there is no ideal site in the Rock Islands due to the topography. Originally set up for radio modem transfer of data from the station, it is now linked to a satellite connection for internet access to the data. Live data are accessible online. Historical data from this station are also archived with PACIIOS in Hawaii. An equivalent system was previously set up on a floating platform within Jellyfish Lake, documenting the different microclimate of the lake. The comparative data from the lake station helped us to better understand the relationship between the weather and the physical properties of the lake.
CRRF’s newest autonomous weather station is located in the Ngardok Nature Reserve (7.51083° N, 134.60755° E), part of the Melekeok Conservation Network and provides detailed data on the conditions affecting the permanent ForestGEO plot, part of the study of landscape change and forest dynamics in Palau. Live data are accessible online. This station is supported by the Institute of Pacific Islands Forestry, US Forest Service, Hilo, Hawaii.
In addition, the Scripps Institution of Oceanography (SIO), University of California San Diego (UCSD) has provided “Xmet” autonomous weather stations, currently for two locations in Palau: one on the western barrier reef- Ongingiang Island and the second at Helen Reef Atoll, far to the southwest from the main island group. The Xmet data is available here.
Meteorological Monitoring- Does Weather Vary in the Tropics?
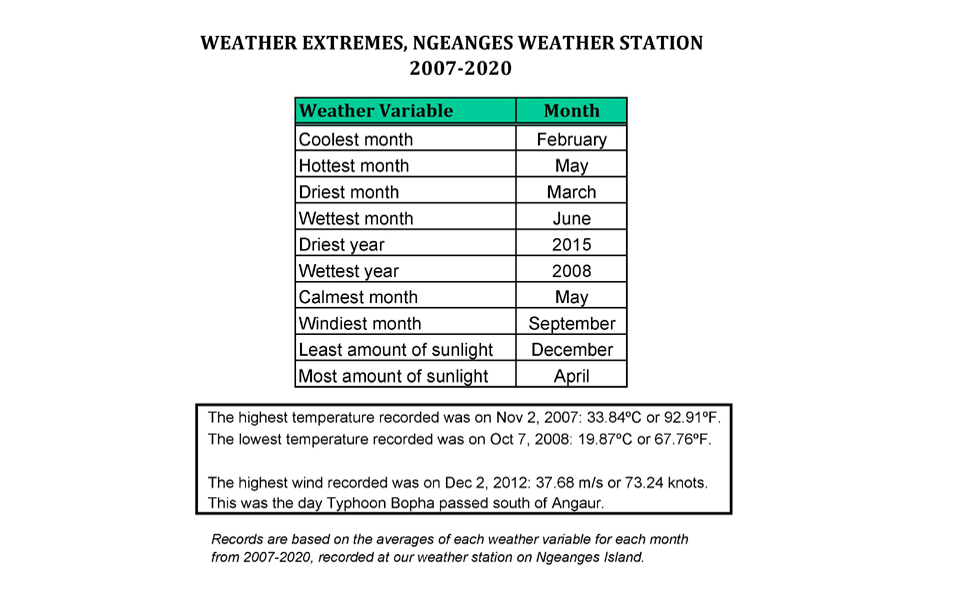
The tower weather station on Ngeanges Island (TWS) is important due to its location, isolated from obstructions (eg. tall manmade structures), and reflects the conditions that are impacting the marine and reef areas away from the large land masses of Babeldaob and Koror. The weather station documents the change of the seasons in Palau: the north easterly trade winds (Oct-May) and the westerly monsoon (June-Sept) with corresponding seasonal rain patterns. It is also important in recording weather patterns during El Niño and La Niña events. As one might imagine, air temperature does not vary much during the year in Palau.
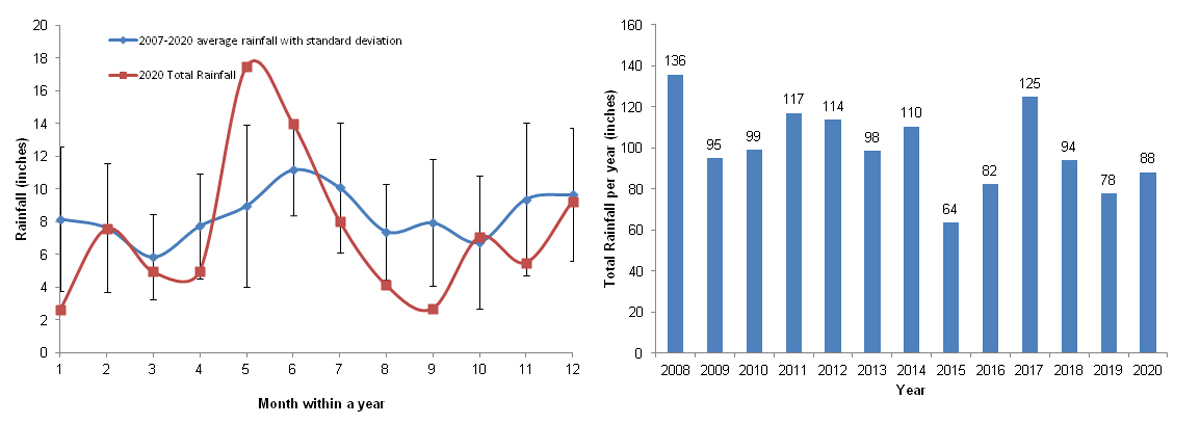
The total rainfall on Ngeanges Island (below) has varied over the years the TWS has been running. 2015 had the lowest record of annual rainfall since 2007 indicating a very dry and strong El Niño year, with almost all months except for June recording less rainfall than the long term average. Total rainfall in 2015 was only 64 in. (162 cm), a ~50% decrease compared to the previous years.
The Ngeanges Island TWS was originally supported by funding from the David and Lucile Packard Foundation through our research in Jellyfish Lake. More recent support is from Canada Fund for Local Initiatives.
The pattern of wind speed and direction at Ngeanges Island from 2007 – 2020 (below) clearly shows the seasonal patterns found throughout Palau. The westerly monsoon is prominent in most years during the summer, as strong flow from the west or southwest. In 2010 the monsoon was very weak and rising summer water temperatures (and coral bleaching) were correlated with this absence. The normal wind patterns reappeared in 2011. 2020 was another weak monsoon year, corresponding to an ongoing La Niña.
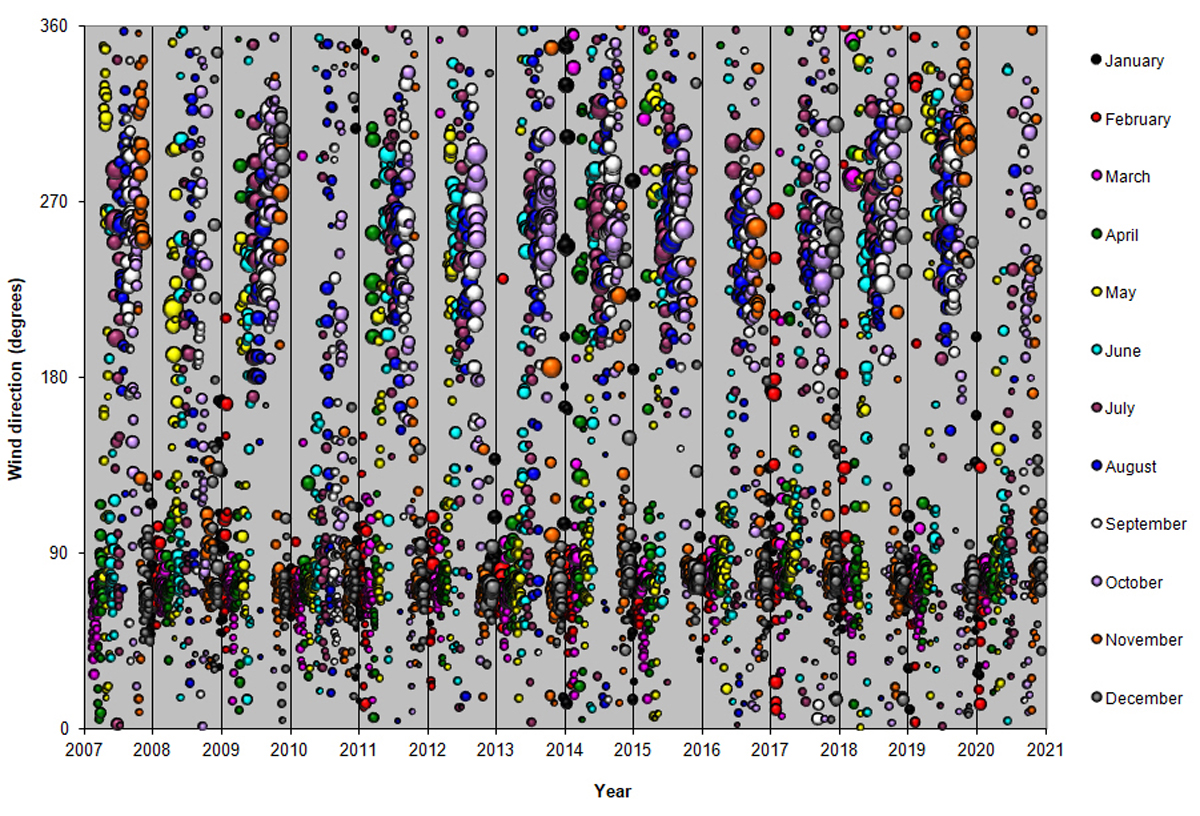
In this bubble plot the magnitude (strength) of the wind speed is indicated by the relative size of bubbles, with time in years on the horizontal axis and wind direction on the vertical axis. The plot clearly shows that in most years the westerly monsoon winds (summer) are stronger than the northeast trade winds (winter). Data shows the relatively weak westerly monsoon in 2010 and 2020 which correlates with coral bleaching.
Palau Weather Patterns
Weather patterns in Palau are well known. Our 13 year data set is not long enough to see patterns relating to climate change, but we can see Palau’s typical weather patterns. The north east trade winds (Dec-May) generally correspond to drier weather in Palau when rainfall is the lowest. The westerly monsoon season (Jul-Sep), when Palau can get strong west/south westerly winds, corresponds to the wettest season. May-Jun and Oct-Nov tend to be months of transition, when the winds switch from easterly to westerly (May-Jun), or vice versa (Oct-Nov). Generally, the calmest weather is Palau occurs during these transition months. Nov/Dec are also the peak typhoon season for Palau, when it has the greatest chance of a direct hit by a typhoon. These are average patterns and it’s important to remember that over decades, there can be variation due to the impact of climate influences, such as ENSO and others etc.
Why is Weather Important?
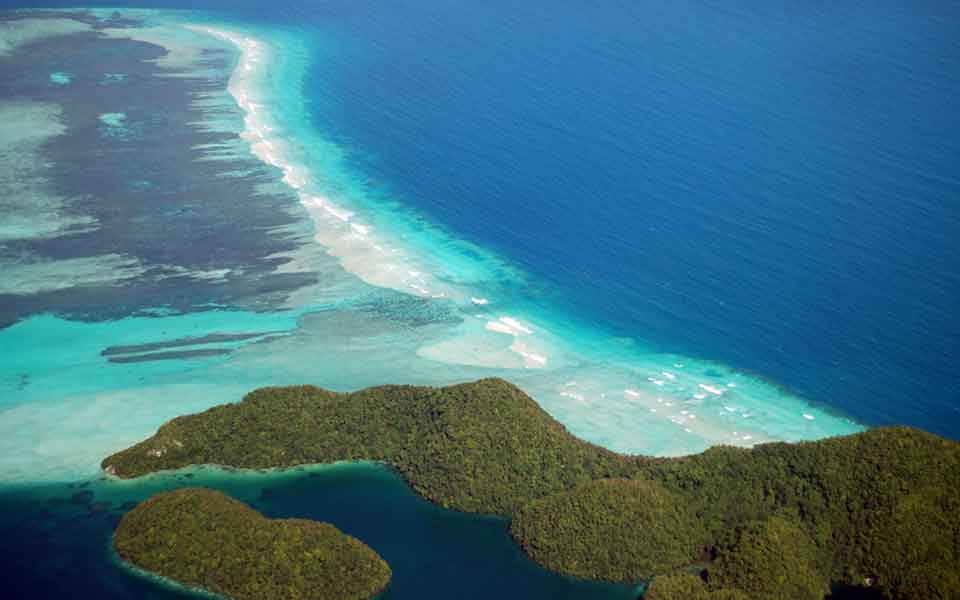
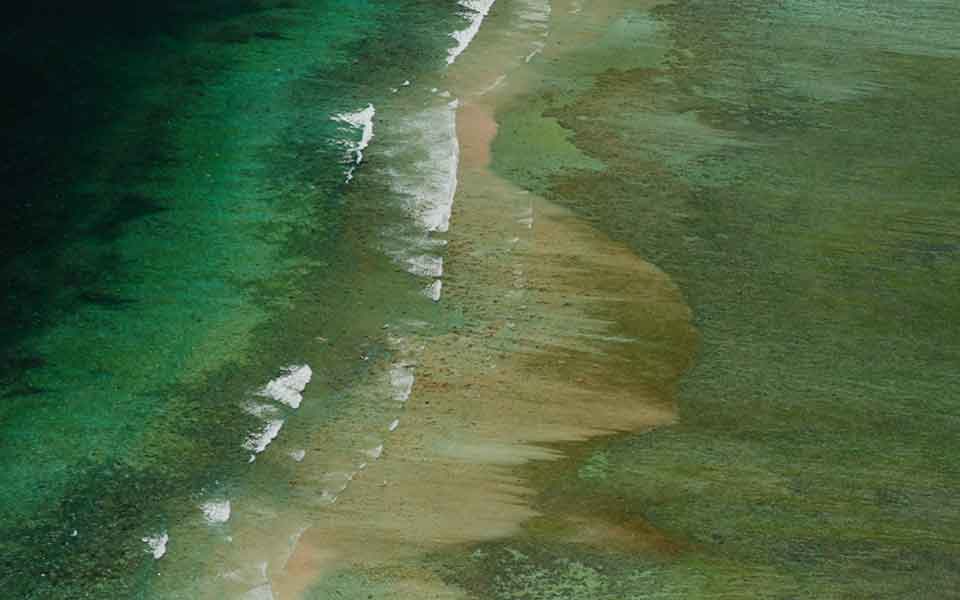
Wind speed and direction data are important to marine environments, and for understanding the types of waves found in both inshore and offshore environments. Waves are the drivers of island and beach erosion, moving sand one direction or another over time, deleting or enhancing beaches. Ocean waves expend vast amounts of energy on outer reef faces, both from distant ocean swell which travels to Palau and more local wind driven waves. The outer reefs serve as buffers to protect more inshore sheltered areas from such wave action. Inner reefs are also impacted by wind waves although ocean swell seldom plays an important role in their development. A number of wave gauges have been placed on the outer reefs of Palau for the last few years to measure the height and period of waves in coming seas. Having local wind information allows us to assess the importance of nearby wind effects on wave energy versus distant swells and waves coming into to hit the reefs.
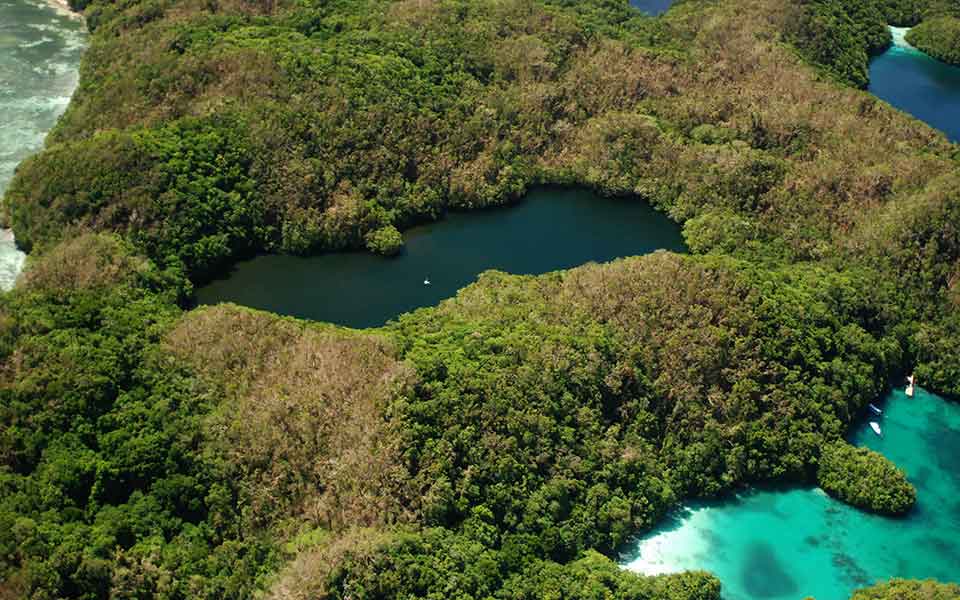
The meteorological data collected from the Ngeanges and Jellyfish Lake weather stations will be used for Jellyfish Lake modeling. The lake sits in a basin sheltered by surrounding hills, protected from the strongest winds, and overall has much less impact from wind energy than nearby rock island areas. Wind and ‘waves’ are the major factors causing mixing of the water column in the lake and knowing the relationships between atmospheric conditions and the biological and physical parameters of the lake is important.
El Niño–Southern Oscillation (ENSO)
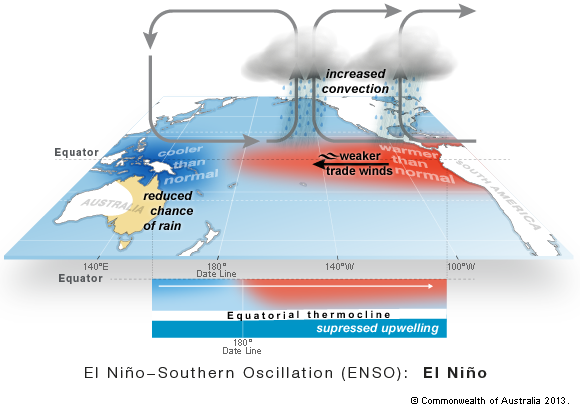
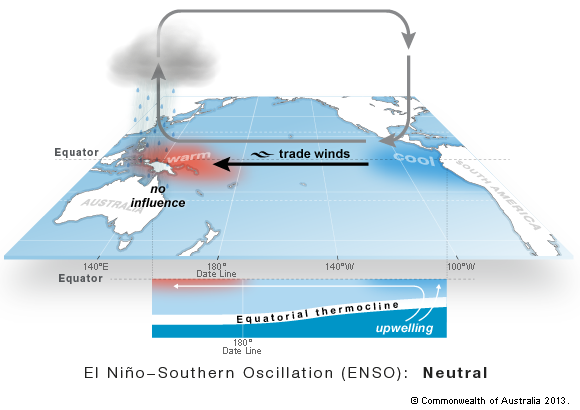
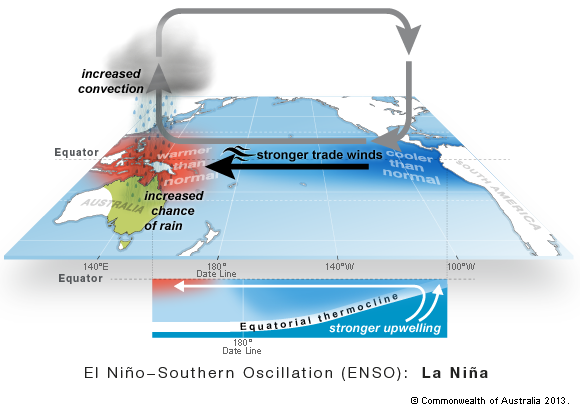
ENSO is a climate phenomenon that periodically fluctuates between 3 phases: Neutral, El Niño or La Niña. ENSO extremes (El Niño and La Niña) can cause serious environmental change in Palau such as coral mortality and a crash of the famous golden jellyfish population. In Palau, located in the far western Pacific, ENSO extremes produce conditions that are different from other geographic areas (such as the central and eastern Pacific). These ENSO fluctuations in Palau are characterized as:
El Niño – Low sea water temperatures, shallow thermoclines and low mean sea levels- generally good for corals in the intermediate depth ranges. However, shallow water corals can be fatally exposed to air during times of low mean sea levels, while mesophotic (deep reef) corals can bleach and die from extreme low temperatures (<15°C) and rapid temperature fluctuations. Very strong El Niños also bring extreme drought- we believe this lack of rain was important in the population crash of the golden jelly in Jellyfish Lake in 1999 and 2016.
La Niña – High sea water temperatures and high mean sea levels- high temperatures extend to depths below coral growth (60 m +) so the entire water column is excessively warm with no cool deeper refuge. This causes coral bleaching and mortality throughout the water column, and was the cause of the massive coral bleaching in Palau in 1998. Corals on shallow flats, regularly exposed to very high temperatures, often survive the high water temperatures associated with La Niñas. Mean sea level is also high, but this does not adversely affect reefs through aerial exposure.
ENSO extremes, particularly El Niños, likely serve to limit the depth of Palau coral reefs to only about 60 m.
Images reproduced by permission of Bureau of Meteorology, © 2017 Commonwealth of Australia
“Typhoons are not uncommon, but records for Palau are poor.” (Spennemann, 2004)
Typhoons
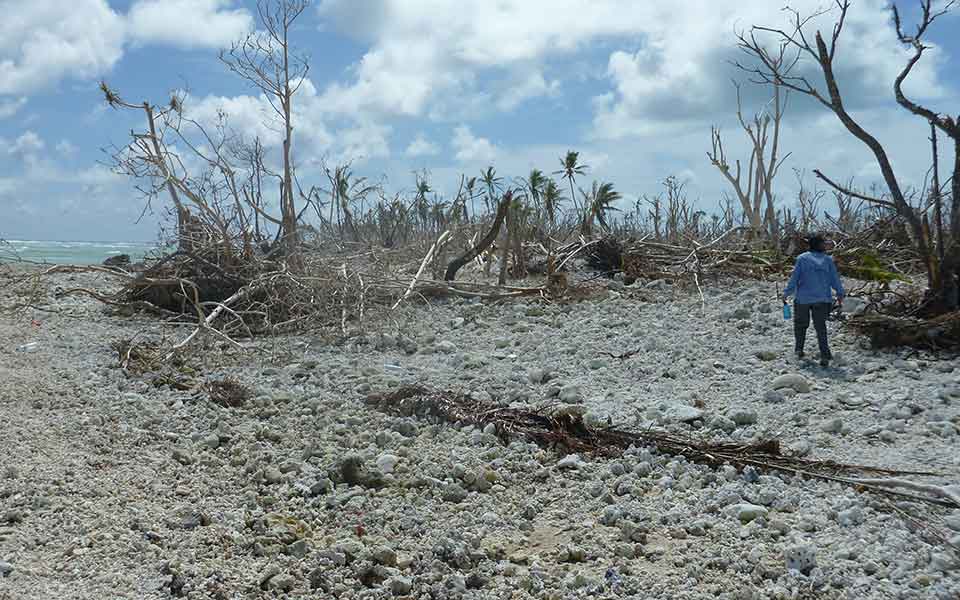
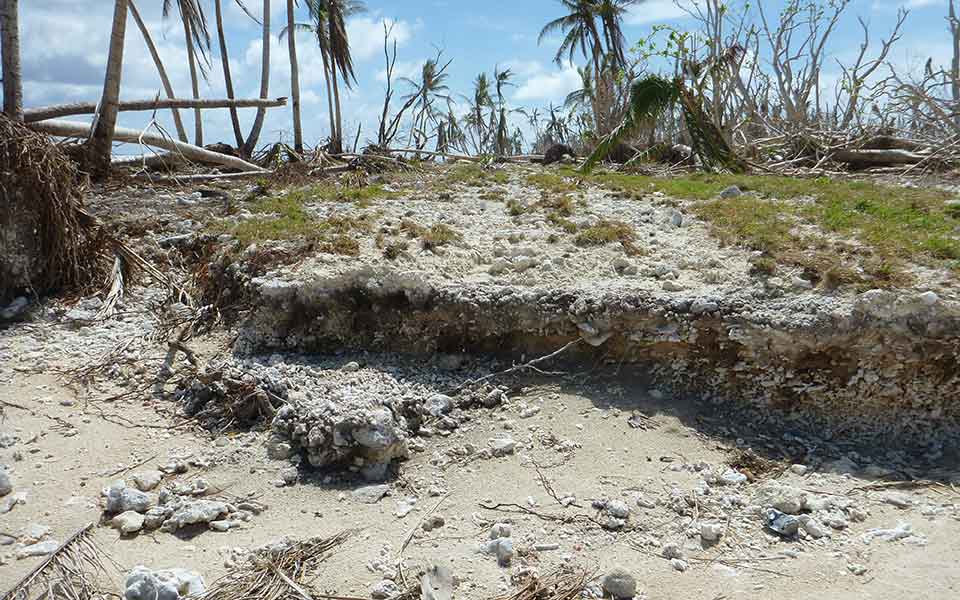
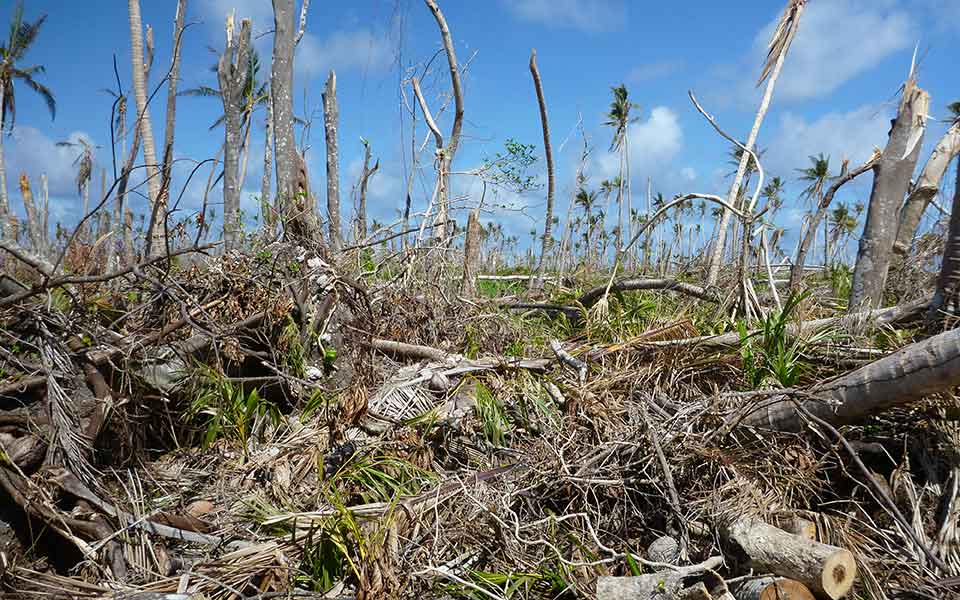
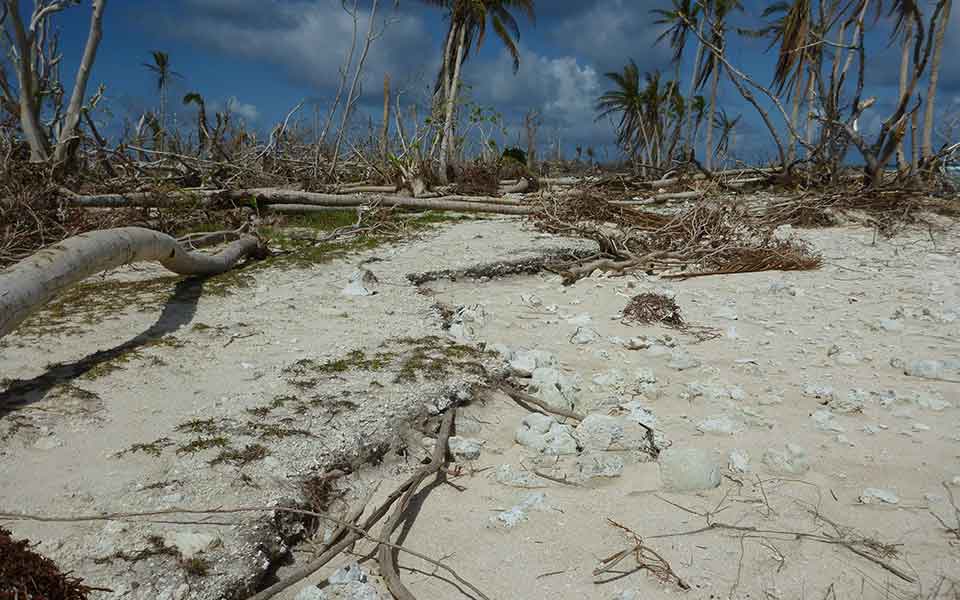
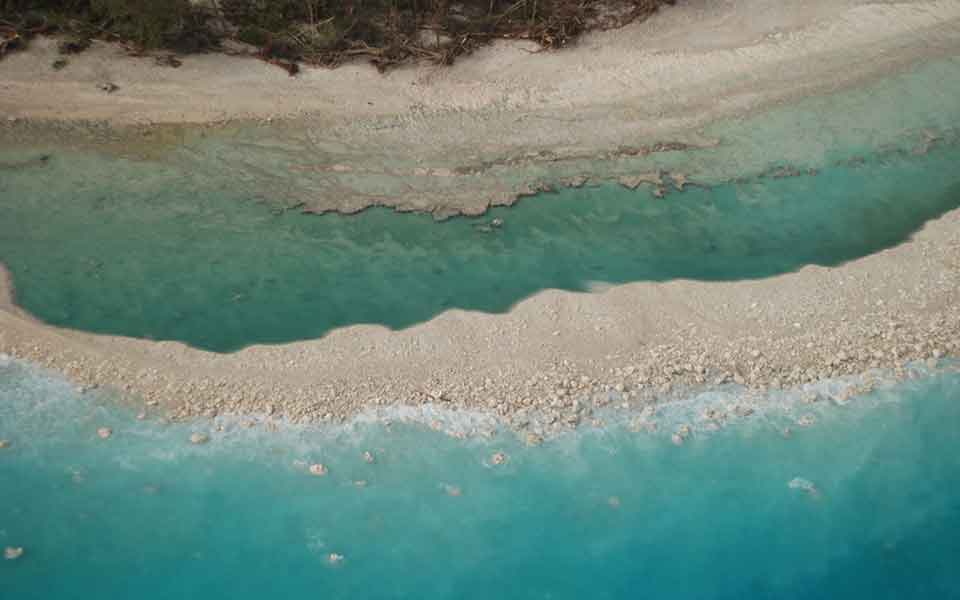
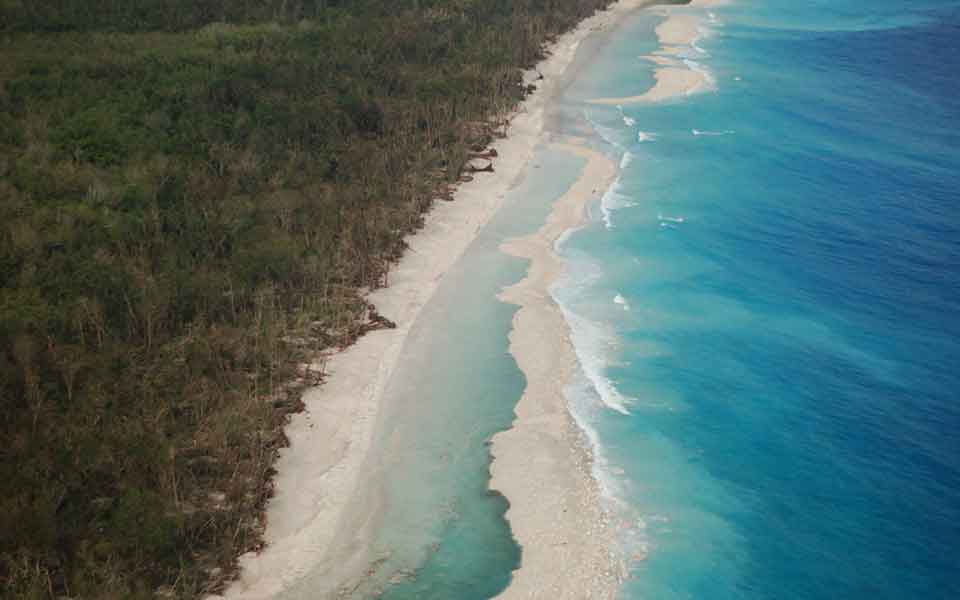
Despite the widespread belief that Palau is below the typhoon belt in the western Pacific, it has been affected by typhoons many times in the past. An updated general review of typhoons affecting Palau was prepared in 2014 by CRRF, following typhoons Bopha (2012) and Haiyan (2013), which both had lasting effects on the environment. Since 1945 twenty storms, an average of 1 typhoon every 3 years (≥64kt winds), has come within 200 nautical miles (nmi) of Palau. Of these, 8 were within 35 nmi of Palau. Northern Palau is more likely to be affected than the south, and November/December is considered the ‘peak’ typhoon season.
Storms passing to the south produce winds from an easterly direction, and storms passing to the north produce winds from the west. Every storm is different but patterns tend to be the same. Storms approach from the east and as they pass the wind direction clocks around the compass so it’s easy to tell when the storm is moving away. Storms can have different wind strengths, but can also vary in the amount of rain they will drop and storm surge they produce.
North to south Palau’s main islands span a distance of 93 miles (150km) so it is not unusual for one part of Palau to be more affected than another. The most recent typhoons, Bopha and Haiyan, did just this. Bopha went 25 nmi south of Angaur, impacting Peleliu and Angaur with very strong easterly winds, with lesser winds to the north. Despite the distance it also produced a large storm surge that impacted the entire east coast of Babeldaob. The next year Haiyan passed directly over Kayangel at super typhoon strength, devastating the islands of that atoll, while Peleliu and Anguar, far to the south, barely felt any effects.

This function has been disabled for Coral Reef Research Foundation.


