Sea Level, Tides and Waves
While the tides may seem a simple parameter to understand (they go up and they go down mostly due to gravitational effects of the moon and sun), they are affected by many external factors. Hence tide tables are nothing more than predictions, based on past measurements, and the actual sea level data making up the tide can differ.
Palau has an excellent tide gauge, run by the University of Hawaii Sea Level Center (UHSLC), located on Malakal Island which has provided quality data since 1969. The tidal range in Palau between high and low tide, on a spring tide, can be as much as 2 m (78 inches).
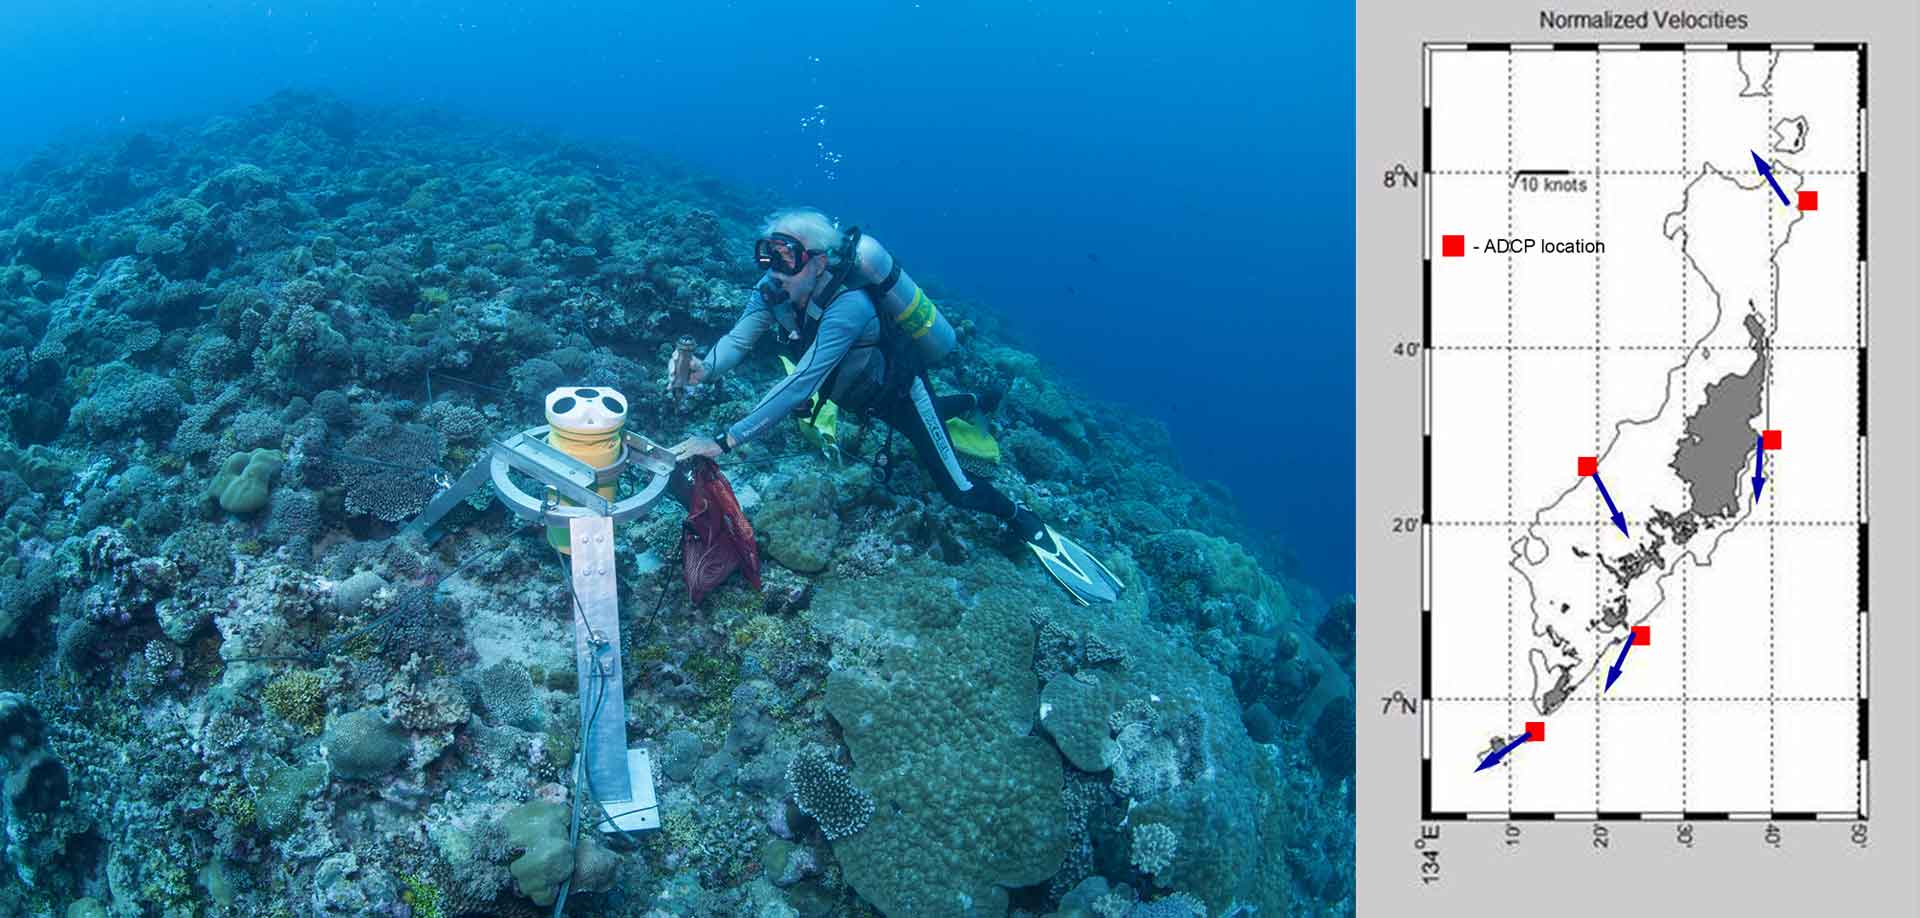
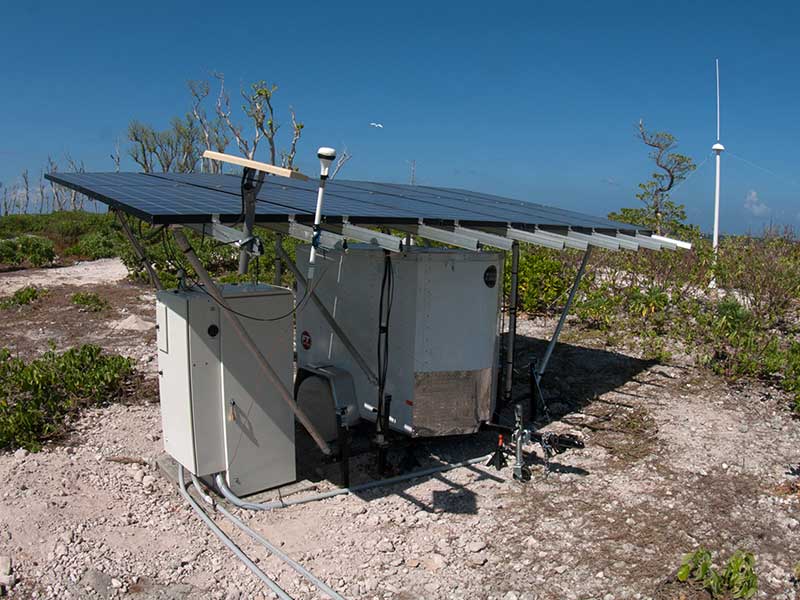
There is local belief that the tide state can vary from north to south within Palau by as much as an hour. We asked this question early on by deploying our own array of a dozen pressure loggers (“tide gauges”) in 2010. Data showed little actual variation in tide geographically within Palau. But it also showed that wind and waves could produce some differences in the timing of tides north to south. At present, for our own purposes CRRF now has two permanent stations: 1) CRRF dock and 2) Malakal Harbor to compliment the Malakal tide station readings. CRRF also maintains a series of loggers in various marine lakes, as the tides in the lakes are damped and delayed.
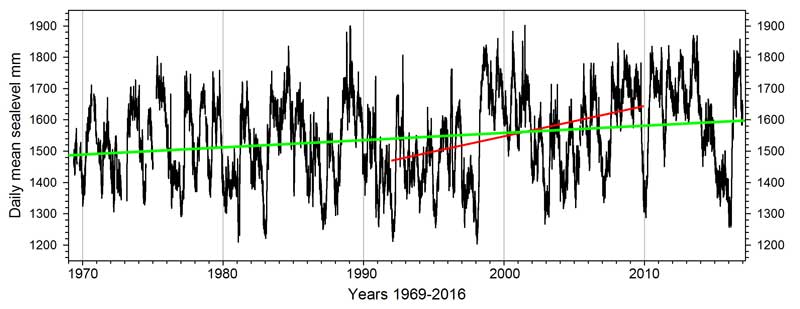
An important aspect of climate change is the mean sea level (MSL) variation. In Palau, between 1969 and 2016 mean sea level has varied, with the most dramatic changes associated with El Niño and La Niña events. Overall the mean sea level in this 46 year period has increased about 2.3 mm per year. In the short term, one or two years, the results can be different. In the past decade Palau’s sea level was reported to be rising 9 mm/yr, based on satellite sea surface height data from 1992 to 2010 (red regression line in Figure). This was actually true for that time period, but expanding the record both before and after indicates the overall rate falls back to less than 3 mm a year and is consistent with worldwide sea level rise rates.
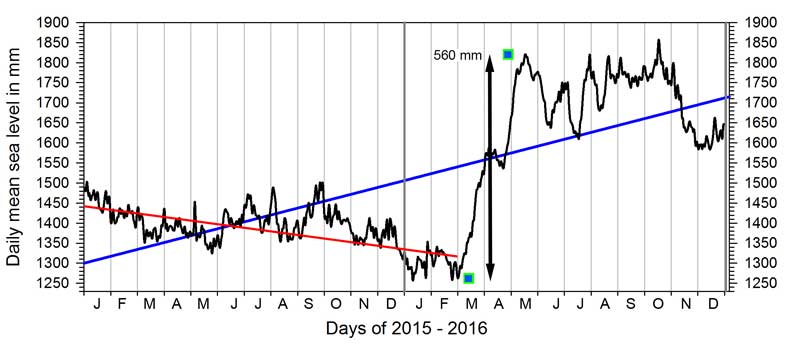
A great example of short term mean sea level change was during 2015-2016. Mean sea level data for Palau in 2015 clearly showed the strong El Niño, where MSL decreased considerably throughout the year, with an average decrease of 90 mm/yr. (red line on Figure). This trend, however, was short lived. As the El Niño waned towards ENSO neutral, in March 2016 the MSL rose rapidly to 40-60 cm higher than in 2015! Between 1 March and 15 May 2016, MSL rose 560 mm (56 cm), an average of 7.5 mm PER DAY! The overall trend for the two years was about 205 mm (20.5 cm) upward per year, more than a half mm per day.


